Quick Hits - Government Support for Innovation and AI Adoption
A quick summary of some interesting reads this week
Welcome to the very first Orbit Policy’s Deep Dives newsletter! The newsletter will be a place to explore how we can build a more inclusive, prosperous, and innovative society and economy. It will include a mix of longer essays on topics such as industrial policy, inclusive innovation, place-based policies, and technology adoption, as well as shorter pieces sharing interesting articles and resources and my thoughts on them. This first one will be the latter, a Quick Hits summary of some things that have caught my attention this week. I hope you enjoy it!
Government Support for Innovation
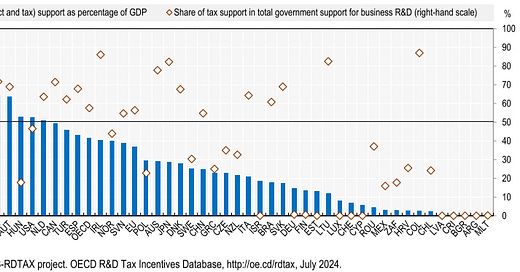
The OECD has a new policy brief on how governments direct support for innovation. It explores the balance between direct and indirect supports, finding that “when it comes to supporting business R&D, the majority of OECD and EU governments have increasingly relied on R&D tax incentives”.
It finds that the tax incentives are effective at raising total R&D but it comes with some caveats. This growth is concentrated among “credit constrained small R&D performers” and that tax credits “are more effective at boosting investment towards incremental development than more transformational, higher spillover-potential knowledge)”. Furthermore, while tax credits are meant to be neutral instruments compared to direct supports, they “are not free from bias, favouring incumbents and the status quo, e.g. driving incremental improvements in polluting technologies as opposed to radical advances in green technologies”.
Canada is among the most dependent on indirect tax credits for R&D, coming in at a little over 70%, higher than the OECD average (Figure 1). This has, however, been declining, as an interesting StatsCan paper on Government Support for Innovation in Canada explored earlier this year. It noted as context for the decline that Canada’s indirect support “had been historically high and one of the most generous in the world, yet its business expenditures on R&D were lower than the OECD average”.
This shift towards greater direct funding is in line with OECD recommendations, with the brief noting that “the OECD calls for sustained investments and greater steering of innovation to contribute to priority transformations, including the use of mission-oriented innovation policies to accelerate the development and uptake of low-carbon innovations”.
As I’ve written in my report Canada’s Moonshot: Solving grand challenges through transformational innovation, moving towards more challenge and mission-oriented innovation is something we need to see happen. Given the scale of challenges we face, more direct innovation support is needed, guided by clear, measurable goals, and a coherent strategy for how to see the benefits of that innovation.
AI Adoption & Job Exposure
New Statistics Canada research by Tahsin Mehdi and Marc Frenette explores the exposure to artificial intelligence in Canadian jobs. They classify jobs into three groups using the median AI occupational exposure index and complementarity scores: (1) high exposure and low complementarity, (2) high exposure and high complementarity, and (3) low exposure (regardless of the degree of complementarity).
Mehdi and Frenette find that “31% of employees aged 18 to 64 in Canada were in jobs that may be highly exposed to AI and relatively less complementary with it, 29% were in jobs that may be highly exposed to and highly complementary with AI, and 40% were in jobs that may not be highly exposed to AI. These findings were largely unchanged compared with those of May 2016 and are consistent with international evidence from other advanced economies, such as the United States”.
They also find that jobs that are potentially highly exposed to AI tend to be those that require higher education though the complementarity varies (Figure 2).
![Potential artificial intelligence occupational exposure (AIOE) and complementarity in Canada This chart shows a scatter plot with the AI occupational exposure index ranging from 5 to 7 on the horizontal axis and the complementarity index ranging from 0.4 to 0.8 on the vertical axis. There are 490 data points. Each data point represents an occupation as per the 4-digit National Occupation Classification version 2016 and are colour-coded with three different colours. The colours are used to distinguish the occupations according to their minimum educational requirement. Occupations requiring a bachelor's degree or higher are represented by blue, occupations requiring some postsecondary education below bachelor's degree are represented by green, and occupations requiring high school or less education are represented by red. The chart shows the relationship between AI occupational exposure and the extent to which AI can play a complementary role in a given occupation. A higher AI occupational exposure index is associated with greater potential occupational exposure to AI. A higher complementarity index is associated with greater potential complementarity with AI. The median AI occupational exposure index score of 6 and the median complementarity index score of 0.6 are used to group the various occupations into four quadrants. The top-left quadrant contain data points representing occupations which might be relatively less exposed to AI and highly complementary with AI. The majority of occupations in that quadrant require some postsecondary education below bachelor's degree but there are also a few which require high school or less education. Some examples include firefighters, plumbers, and carpenters. The bottom-left quadrant contain data points representing occupations which might also be relatively less exposed to AI but also less complementary with AI. The majority of occupations in that quadrant require high school or less education but there are also a few which require some postsecondary education below bachelor's degree. Some examples include food and beverage servers, labourers in processing, manufacturing and utilities, and welders and related machine operators. The top-right quadrant contain data points representing occupations which might be highly exposed to AI and highly complementary with AI. The majority of occupations in that quadrant require a bachelor's degree or higher education but there are a few which require some postsecondary education below bachelor's degree. Some examples include general practitioners and family physicians, secondary school teachers, and electrical engineers. The bottom-right quadrant contain data points representing occupations which might be highly exposed to AI but less complementary with AI. This quadrant has fewer data points than the other quadrants and the occupations represented by the data points have a mixture of educational requirements. Some examples include data entry clerks, economists, computer network technicians, and computer programmers and interactive media developers. Potential artificial intelligence occupational exposure (AIOE) and complementarity in Canada This chart shows a scatter plot with the AI occupational exposure index ranging from 5 to 7 on the horizontal axis and the complementarity index ranging from 0.4 to 0.8 on the vertical axis. There are 490 data points. Each data point represents an occupation as per the 4-digit National Occupation Classification version 2016 and are colour-coded with three different colours. The colours are used to distinguish the occupations according to their minimum educational requirement. Occupations requiring a bachelor's degree or higher are represented by blue, occupations requiring some postsecondary education below bachelor's degree are represented by green, and occupations requiring high school or less education are represented by red. The chart shows the relationship between AI occupational exposure and the extent to which AI can play a complementary role in a given occupation. A higher AI occupational exposure index is associated with greater potential occupational exposure to AI. A higher complementarity index is associated with greater potential complementarity with AI. The median AI occupational exposure index score of 6 and the median complementarity index score of 0.6 are used to group the various occupations into four quadrants. The top-left quadrant contain data points representing occupations which might be relatively less exposed to AI and highly complementary with AI. The majority of occupations in that quadrant require some postsecondary education below bachelor's degree but there are also a few which require high school or less education. Some examples include firefighters, plumbers, and carpenters. The bottom-left quadrant contain data points representing occupations which might also be relatively less exposed to AI but also less complementary with AI. The majority of occupations in that quadrant require high school or less education but there are also a few which require some postsecondary education below bachelor's degree. Some examples include food and beverage servers, labourers in processing, manufacturing and utilities, and welders and related machine operators. The top-right quadrant contain data points representing occupations which might be highly exposed to AI and highly complementary with AI. The majority of occupations in that quadrant require a bachelor's degree or higher education but there are a few which require some postsecondary education below bachelor's degree. Some examples include general practitioners and family physicians, secondary school teachers, and electrical engineers. The bottom-right quadrant contain data points representing occupations which might be highly exposed to AI but less complementary with AI. This quadrant has fewer data points than the other quadrants and the occupations represented by the data points have a mixture of educational requirements. Some examples include data entry clerks, economists, computer network technicians, and computer programmers and interactive media developers.](https://substackcdn.com/image/fetch/w_1456,c_limit,f_auto,q_auto:good,fl_progressive:steep/https%3A%2F%2Fsubstack-post-media.s3.amazonaws.com%2Fpublic%2Fimages%2F925197f2-a199-4fa2-a8dc-41324539a6a3_861x624.png)
What this means in job impacts and employment remains to be seen. Early adoption of AI has been bumpy, not yielding the promised benefits. A study by the Upwork Research Institute earlier in the summer found that “nearly half (47%) of employees using AI say they have no idea how to achieve the productivity gains their employers expect, and 77% say these tools have actually decreased their productivity and added to their workload.”
So much will come down to how we go about implementing AI. I think we need to encourage a worker-oriented approach to AI adoption that is grounded in principles of worker augmentation rather than automation and worker replacement. This would include providing adequate skills training for employees - the Upwork study also found that only 26% have AI training programs in place for their workforce.
I think successful AI adoption also needs to be built on a “bottom-up” rather than a “top-down” process. As the StatsCan study shows, high-exposure work is heavily found in knowledge-work professions. These are fields where workers are often highly autonomous and highly varied in how they do their work. Technology adoption in those circumstances is very unlike technology adoption in, say, factories where there is a more mechanical and easily mapped process. Ensuring workers buy into the process of technology adoption, helping guide the strategy in ways that ensure new technology enhances their work rather than detracts from it, is more likely to yield promised productivity benefits.